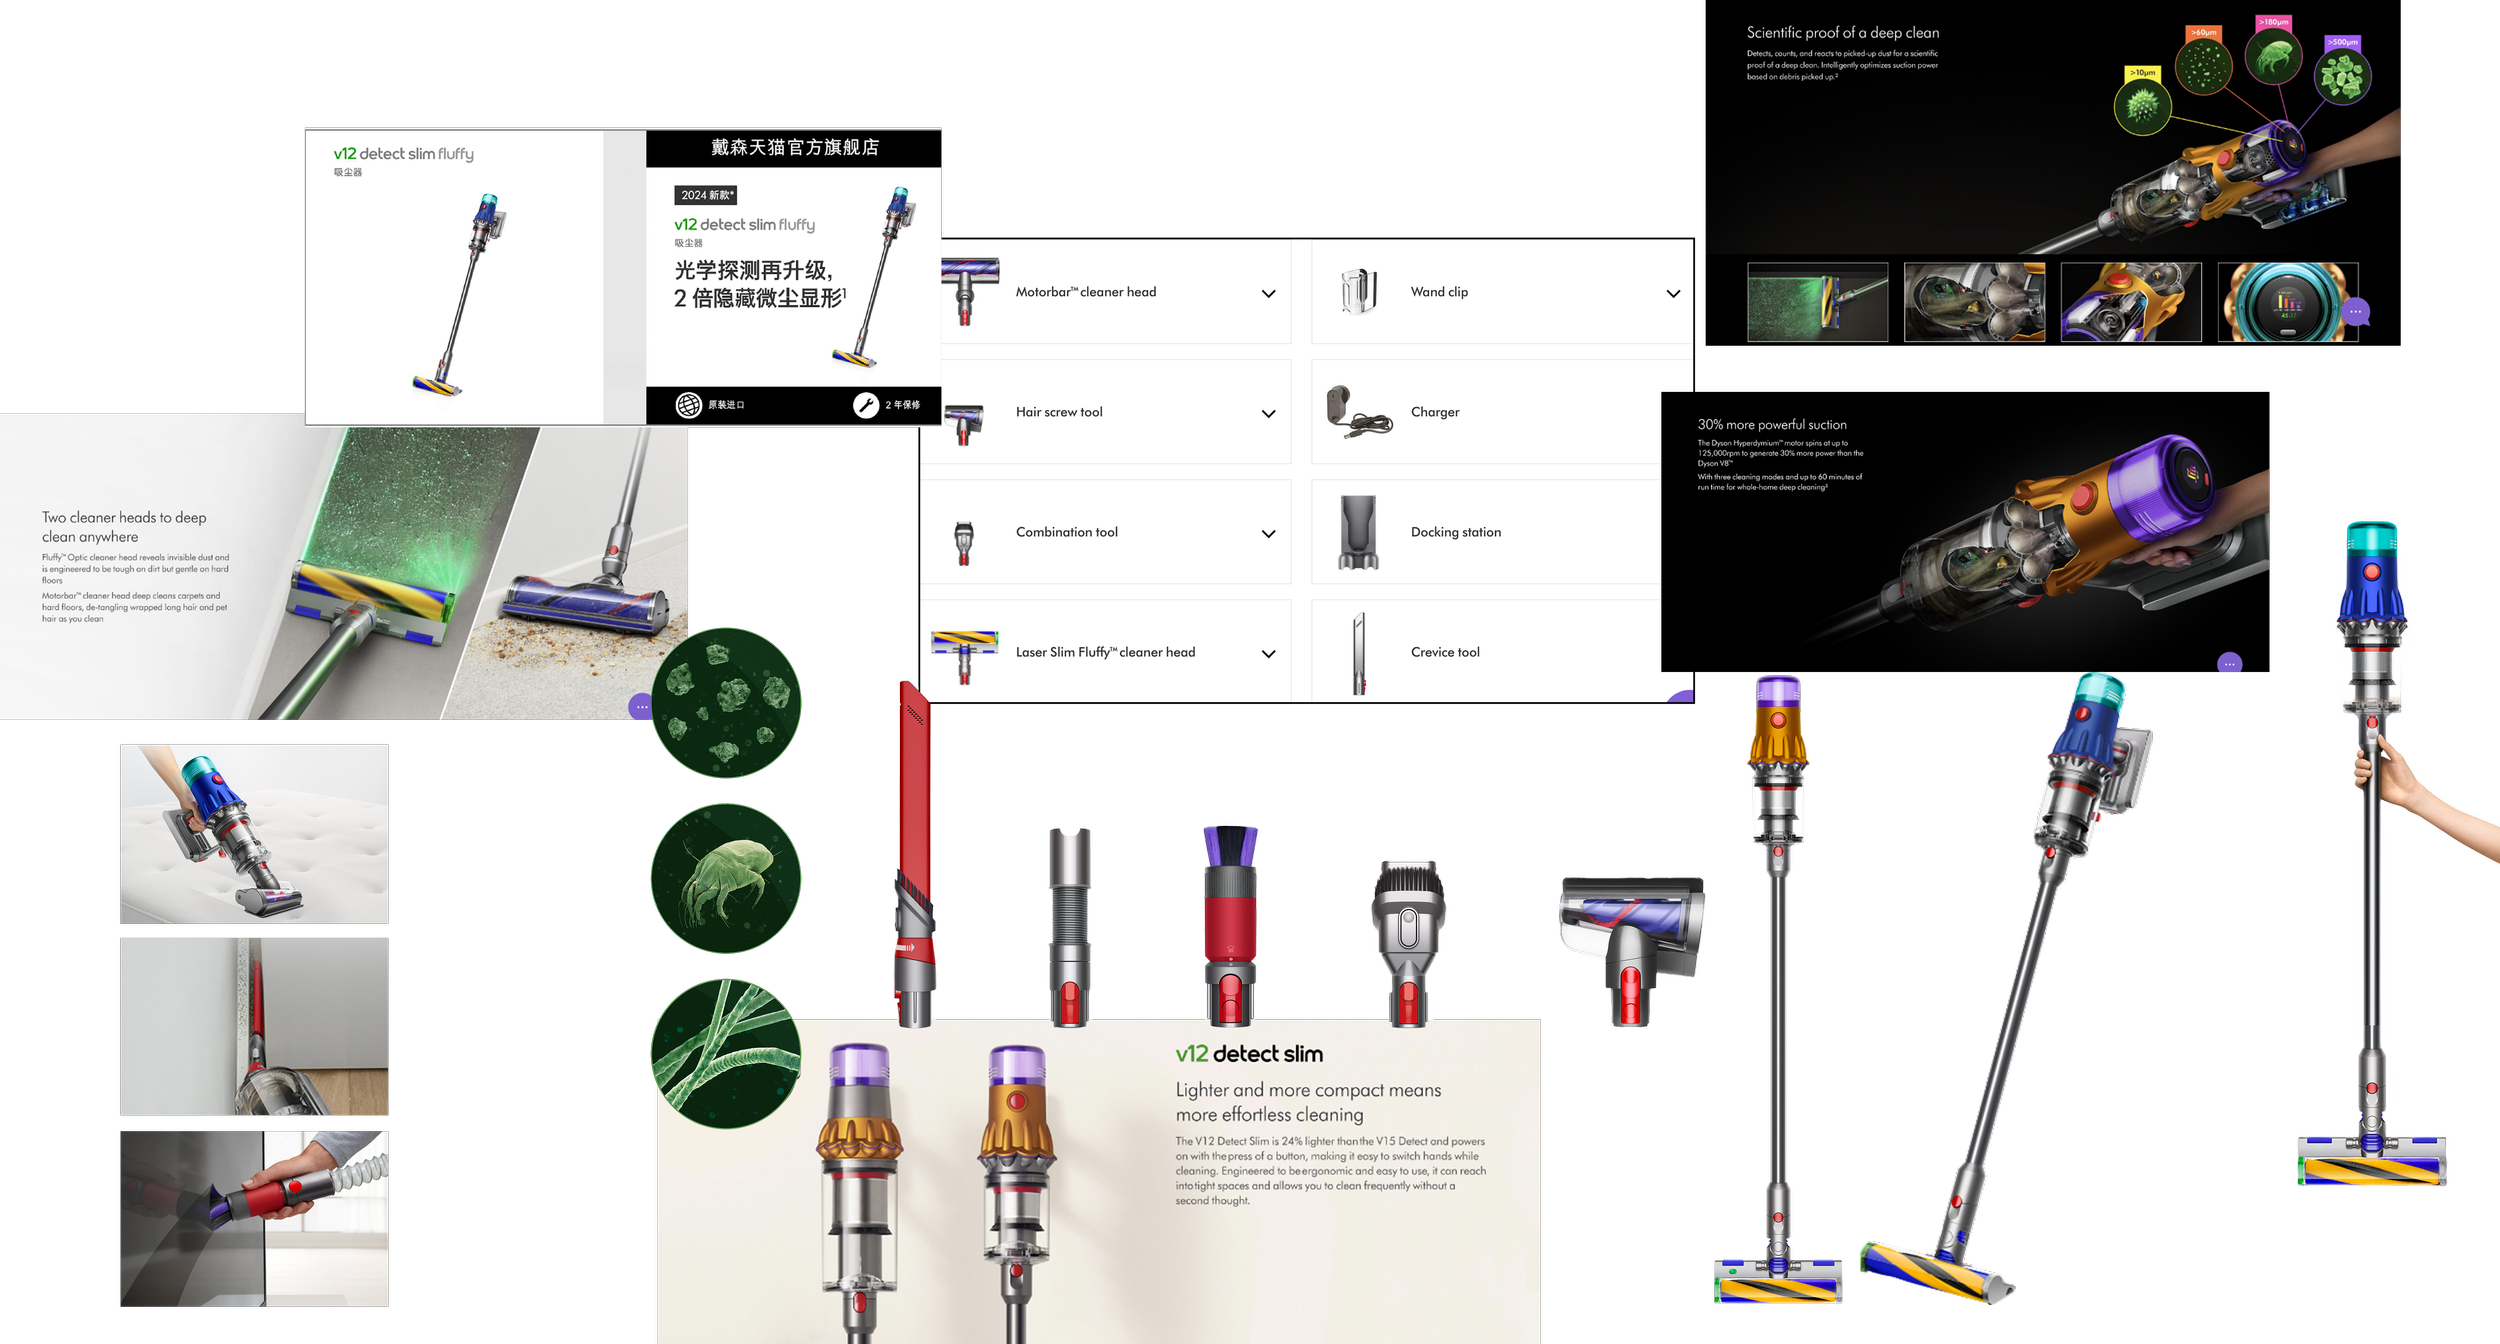
Dyson v12 detect slim fluffy (2024 newest) Infographic Design
This design challenge was given by an international trade company.
The goal was to create a visually engaging and informative infographic that highlights the key features and benefits of the Dyson V12 Detect Slim Fluffy vacuum cleaner.
The infographic is meant to serve as a marketing tool—educating potential customers and encouraging purchases by showcasing the product’s innovative technology, strong performance, and user-friendly design.
Role
Graphic Designer
Tools
Figma
Photoshop
Illustrator
Timeline
2 weeks

Research & Moodboard
Conducting secondary research and creating a mood board helps me maintain design cohesion.
Initial Layout
Introduction: Brief overview of the product, such as key features and benefits
Three usage scenarios of the product

Product component breakdown
Products comparison: Highlight advantages of the new product in size and weight

Key Challenge
The key challenge in this project was refining the design through multiple iterations.
Most of the iteration work was done using A/B testing to explore the most effective way to present information.
I paid close attention to the details—especially grid layout design—using grids to align frames for a clean, sharp structure. This also included adjusting text size and content to control frame length and visual balance.
In addition, I conducted color and font studies to ensure visual consistency with Dyson’s brand language. The color study also helped me explore how to use color to structure content and highlight key information, drawing viewers’ attention more effectively.

I enlarged the product image, allowing part of it to extend beyond the original frame. This breaks the rigid layout and creates a stronger visual connection between the upper and lower content.


I also used colors to separate different sections of the content and used different colors to highlight info hierarchy.
I edited the text and adjusted the content to align with the image’s width, keeping it within the grid. I also used bold text and changed the color to highlight the title.


Enlarged numbers and placed them on separate lines to visually draw attention and made information easier to grasp quickly.


I was exploring an effective way to compare products that highlights the advantages of the new product.
At first, I simply aligned the two products horizontally, which clearly showed the size differences. Following my professor’s advice, I faded the comparator since it’s not the main focus. This not only highlights the main product but also creates more space for placing and adjusting text. Additionally, using lines to indicate width and length helps viewers better understand the comparison.


I used colors to separate the content and made small adjustments to the text.


Color Study: Explored color schemes.

Final PresentationPerfects.AI Design System Construction
Ganzhu Tinned Fish Package Redesign

Tim Hortons’ Rewards User Experience Enhancing